
Documentation
Interface tour
The window
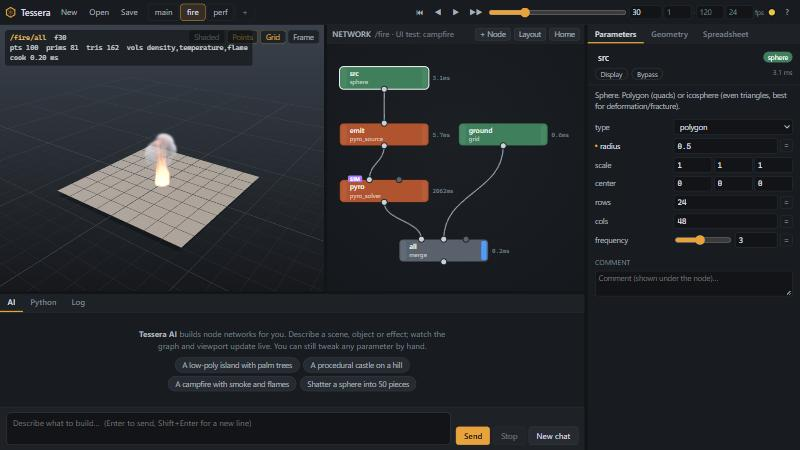
The Tessera window has five areas: the top bar, the viewport, the node graph, the dock with the AI, Python and Log tabs, and the right panel with Parameters, Geometry and Spreadsheet.
Top bar
- New / Open / Save
- New starts a new, empty project tab. Open opens a bundled example or a
.tsrfile by path, in its own tab. Save (Ctrl+S) writes the project to its current.tsrfile (asking for a name the first time); Save As is Ctrl+Shift+S. A bare name is saved to %USERPROFILE%\Tessera\scenes. - Undo / Redo arrows
- Step back and forward through the project’s history. See Undo & redo.
- Project tabs
- One tab per project. + adds a project, double-click renames, × closes. See Projects & graphs.
- Timeline
- First frame, previous frame, play / pause, next frame, a frame slider and the current frame, the frame range (start and end) and frames per second. Simulations and time-dependent nodes cook at the current frame.
- Unreal
- Opens the Unreal link panel; its dot turns on when an editor is connected. See Unreal live link.
- Engine dot
- Green: engine connected. Pulsing amber: cooking. Red: connection lost.
- ?
- Keyboard shortcut overview (also ?).
- ☰
- Shows or hides the right panel (useful in narrow windows).
Viewport
The 3D view of the current graph’s display node. Its toolbar has Shaded (cycles shaded / wire on shaded / wireframe), Points (P), Grid (G) and Frame (F). The heads-up display in the corner shows the node path, frame, point / primitive / triangle counts, volumes and the cook time. A progress bar appears during long cooks. See Viewport for navigation.
Node graph pane
The header holds the graph tabs (one per graph in the project, plus + and ⊕ Combine), the path of the current graph, and three buttons: + Node (opens the node menu, same as Tab), Layout (L) and Home (H, frame the network). Nodes are coloured by category, show their cook time, a SIM badge for simulations, and the comment under them. See Node graph.
AI, Python and Log dock
- AI
- The conversation with the AI: its plan, its messages and a chip for every tool call (add nodes, render, check layout…). Below: the prompt box (Enter sends, Shift+Enter for a new line), Send, Stop, New chat, the provider menu and the model menu. See Using the AI.
- Python
- Runs Python inside the engine with
scene,tessera,np,Geometry,ops(),add(),cook()andrender()ready. Run or Ctrl+Enter. The value of the last expression (or a variable namedresult) is shown with anything printed. See Python & HTTP API. - Log
- Every graph op, engine event and log message, with filters (ops, events, log) and Clear. A badge on the tab counts new messages.
Parameters, Geometry, Spreadsheet
- Parameters
- For the selected node: its name (edit to rename), type chip, Display and Bypass flags, Reset sim for simulations, cook time, errors and warnings in red / yellow, the node’s documentation (click to expand), every parameter, and a Comment box whose text appears under the node. See Parameters.
- Geometry
- A summary of the selected node’s output: counts, bounding box and size, attributes by owner, groups and volumes.
- Spreadsheet
- Attribute values row by row, for Points, Primitives, Vertices or Detail, paged with the arrows. Groups show as
grp:namecolumns.
Menus and dialogs
- Node menu: right-click empty graph space, Tab or + Node. Categories, nodes and docs side by side; type to search, arrow keys to move, Enter to add, Esc to close.
- Unreal panel: detected editors, node and asset name, Send to Unreal, Live link, Refresh, and the result of the last send.
- Shortcut help: ?. Esc closes it.
Resizing panels
Drag the splitters between viewport and graph, between the upper area and the dock, and in front of the right panel. In narrow windows the right panel becomes a drawer you open with ☰ and close with × or Esc.